In the previous article, we performed the client configuration in Grafana. Now let’s create the monitoring charts by creating Grafana dashboards.
Computer Status Chart
Let’s create Grafana Dashboards to help us monitoring our internal servers. Access Grafana and click on “Dashboards” in the left sidebar menu. On this screen, click on “Create Dashboard” and then on “Add Visualization.”

Here you should choose the data source for the chart, select the host’s data source.

Let’s create a chart that will show whether the machine is online or offline.
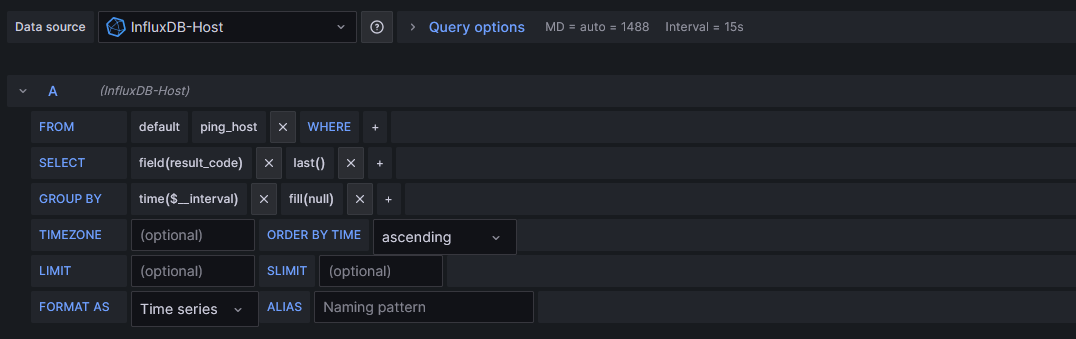
Here at the bottom, let’s configure as follows. In the “From” field, select the metric “ping_host” (This metric was added when editing the “telegraf.conf” file).
In “Select,” choose “result_code” and “last()“.
It should look like this:
Now, on the right-hand side menu, select “Visualizations” and choose the “Stat” option.
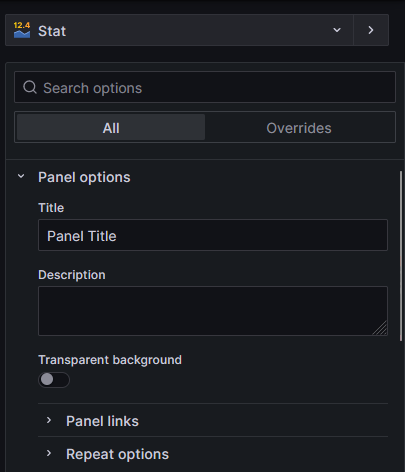
In “Panel options,” give a title to the chart, it can be “Host” to indicate that it is the Grafana host computer.

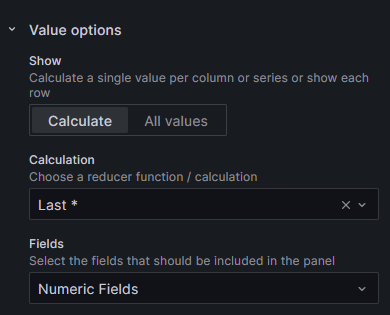
Now in “Value options,” it should be configured like this:
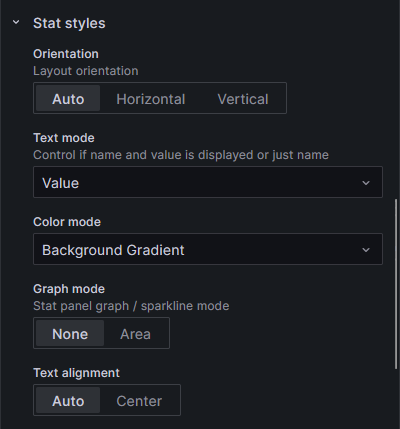
In “Stat styles,” configure as follows:
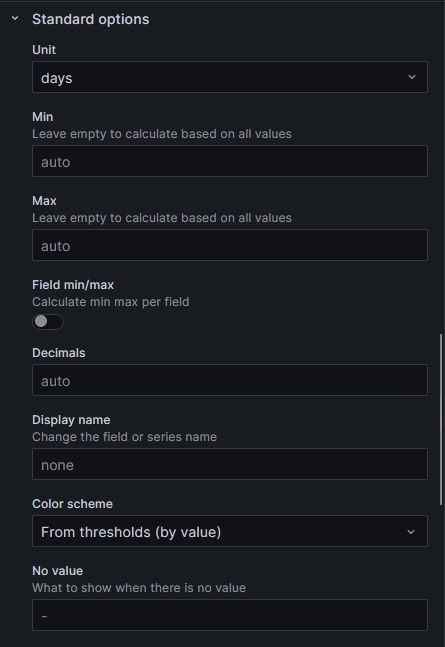
In “Standard options,” configure as follows:

Now in “Value mappings,” click on “Add value mappings” and configure as follows:

In the top right corner, click on “Apply.”

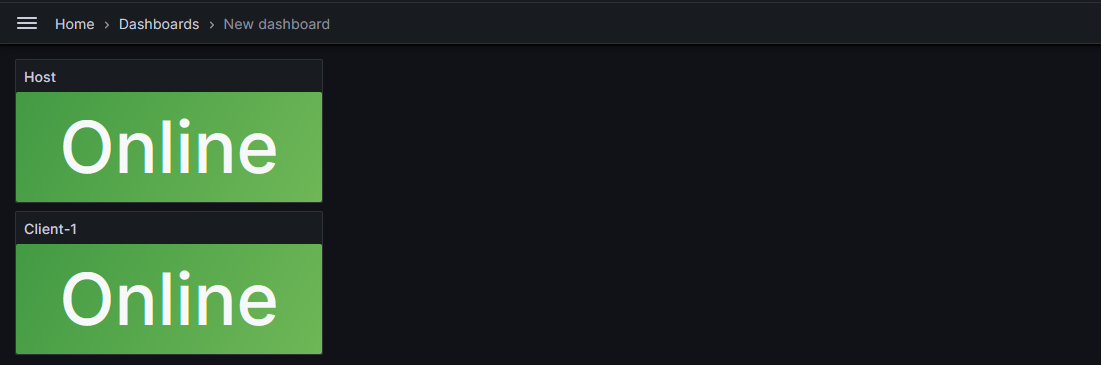
Now you can see the created chart. The chart collects information from the host computer and indicates that it is online. You can resize the chart directly on the screen.
Repeat the entire process for client data sources. In the end, it will look like this:
Disk Storage Chart
It is also important to have Grafana dashboards to monitor storage. Now let’s create a chart to monitor the disk storage.
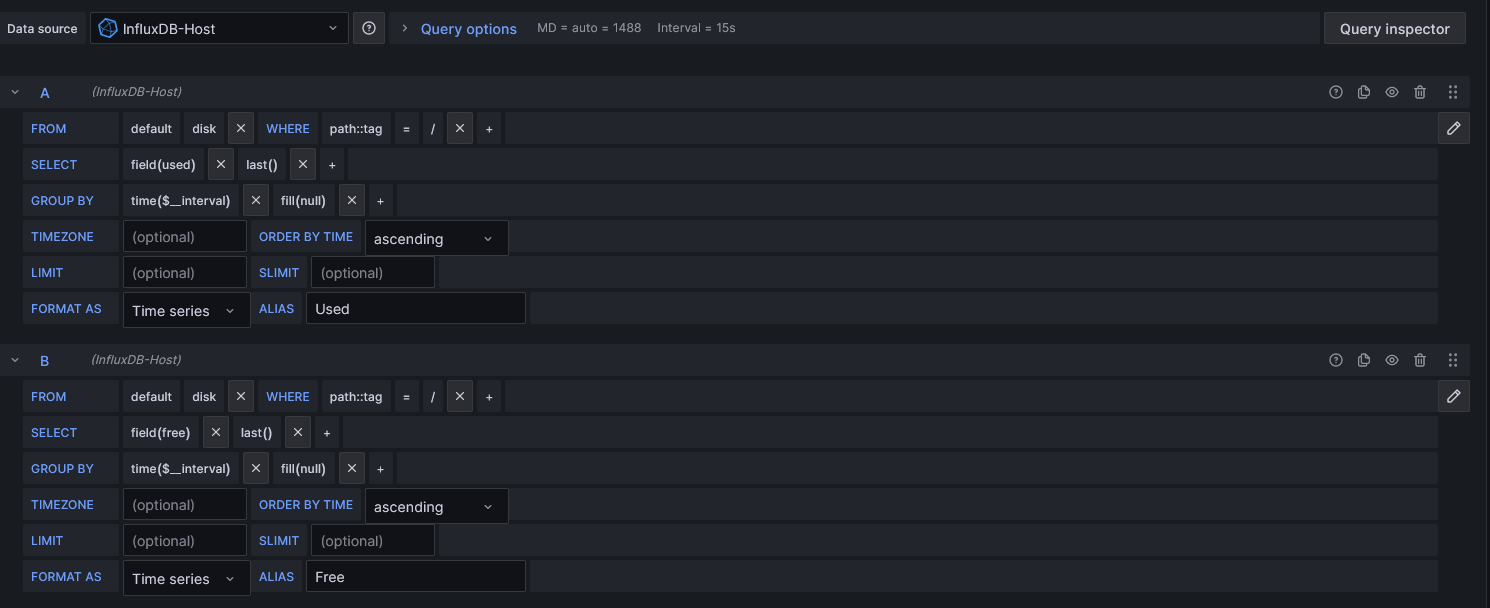
Create a new dashboard and configure it exactly as follows in the bottom menu.
On the right-hand side menu, select the “Pie chart” graph type in “Visualizations.” Give a title to the chart and below, in the “Pie chart” settings, choose “Donut” in the “Pie chart type” option.
Click “Apply” and see the created chart. Repeat the same procedure for all data sources, and it will look something like this:

CPU Monitoring Chart
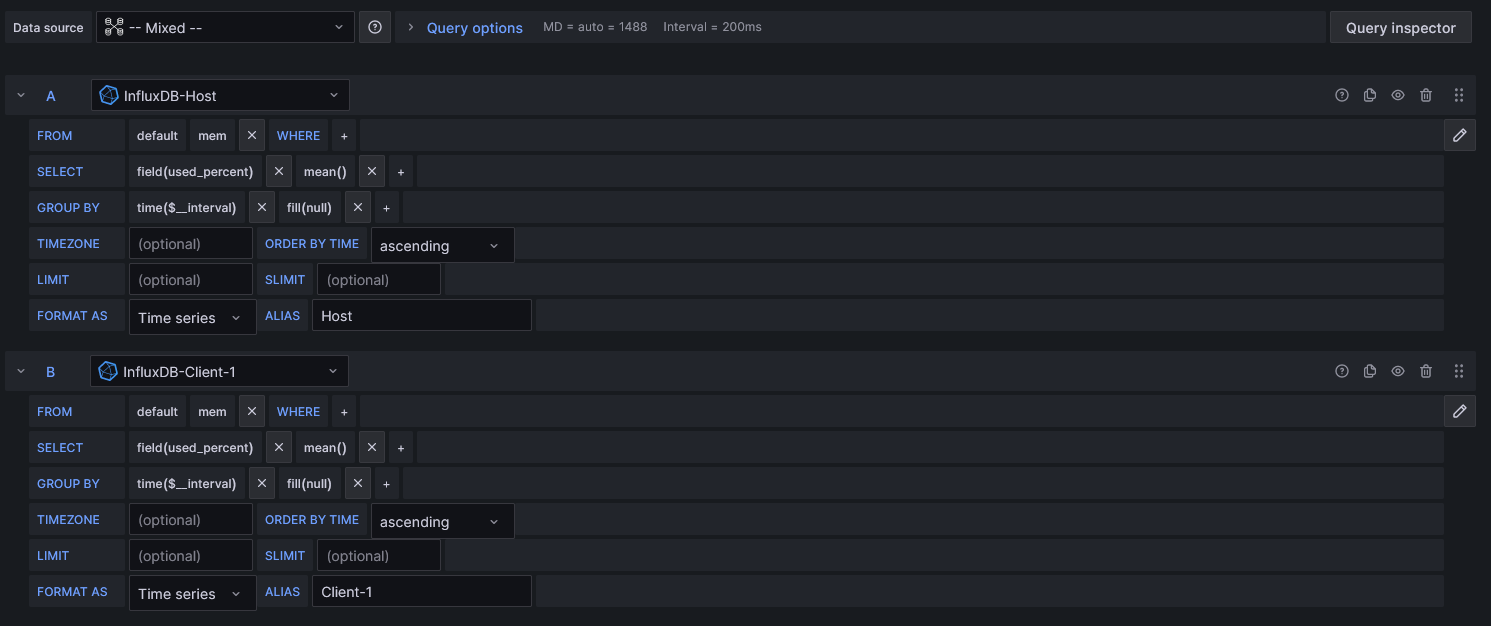
Create a new chart, and this time, pay attention to some important points highlighted in red in the image. In the bottom menu, configure according to the image; this time the data source should be the “Mixed” option. This is because metrics from all computers will be imported simultaneously.
In the “SELECT” field, choose the options “usage_idle,” “mean,” and also add the “math” option with the following value:
*-1+100This is the correct calculation to bring CPU usage information.

On the right-hand side menu, leave the chart type as “Time series” and give the chart a name. Below in “Graph styles,” mark the “Gradient mode” option as “Opacity” and assign a value to “Fill opacity.” In “Connect null values,” mark as “always.”

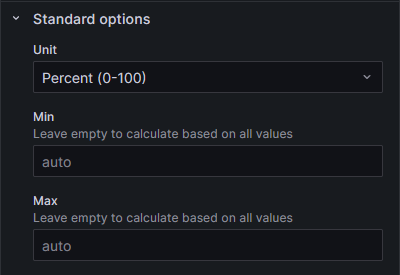
In “Standard options,” in the “Unit” option, select “Percent (0-100).”
Click Apply.
Memory Monitoring Chart
Create another chart and configure the bottom menu as follows:
On the right-hand side menu, configure exactly like the CPU chart configuration. In the end, it should look something like this:

Website Monitoring
Grafana dashboards can also helo to monitor web applications. Let’s perform website monitoring. Since we don’t have any websites hosted on the computers, we’ll use the Grafana website, but you can repeat the process for any of your sites.
Edit the file /etc/telegraf/telegraf.conf on the host computer.
Search for the code block “inputs.http_response” and configure as follows:
[[inputs.http_response]]
  name_suffix = "_site"
  address = "https://grafana.com/"
  response_timeout = "5s"
  method = "GET"
Save the file and restart telegraf:
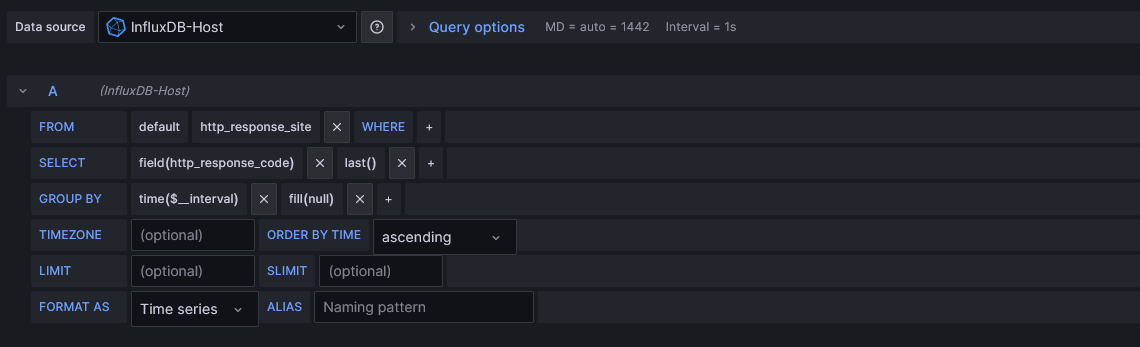
systemctl restart telegrafIn Grafana, create a new dashboard and configure the bottom menu as follows:
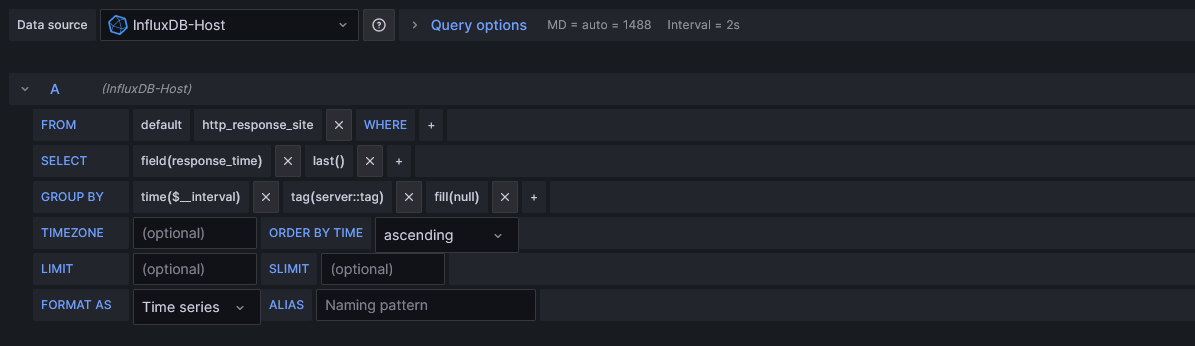
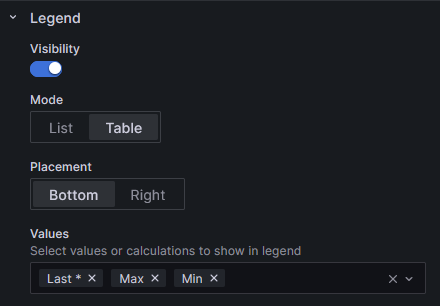
On the right-hand side menu, leave it as “Time series” and go to the Legend options and configure as follows:
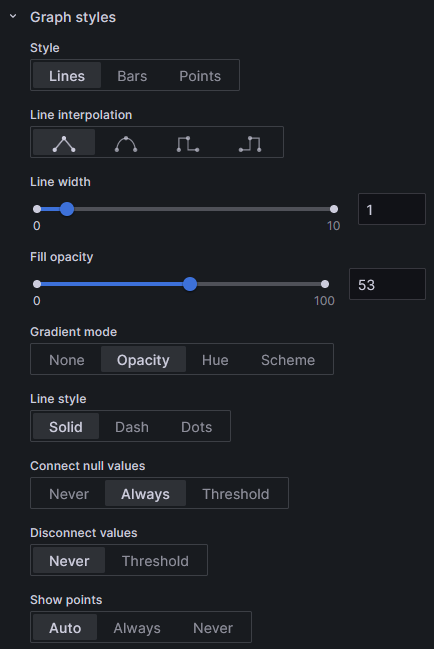
In the Graph style settings, configure as follows:
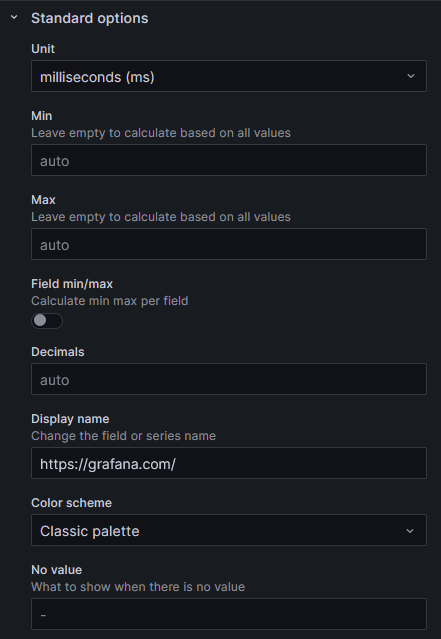
In “Standard options,” configure as follows:
Click Apply.
Create a new chart and configure the bottom menu as follows:
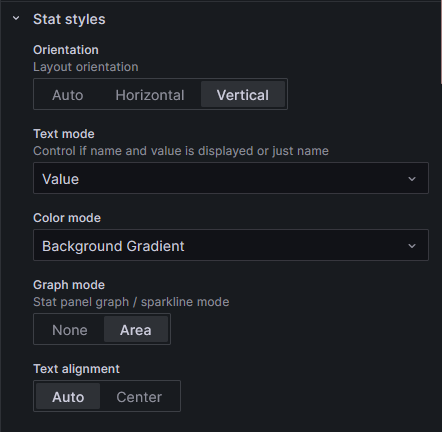
On the right-hand side menu, select “Stat” as the chart type and in the “Stat styles” settings below, configure as follows:
Further down, in “Value mappings,” click on “Add value mappings” and configure as follows:

Note that all parameters are of the “range” type.
Click Apply.
You now have the following monitors:
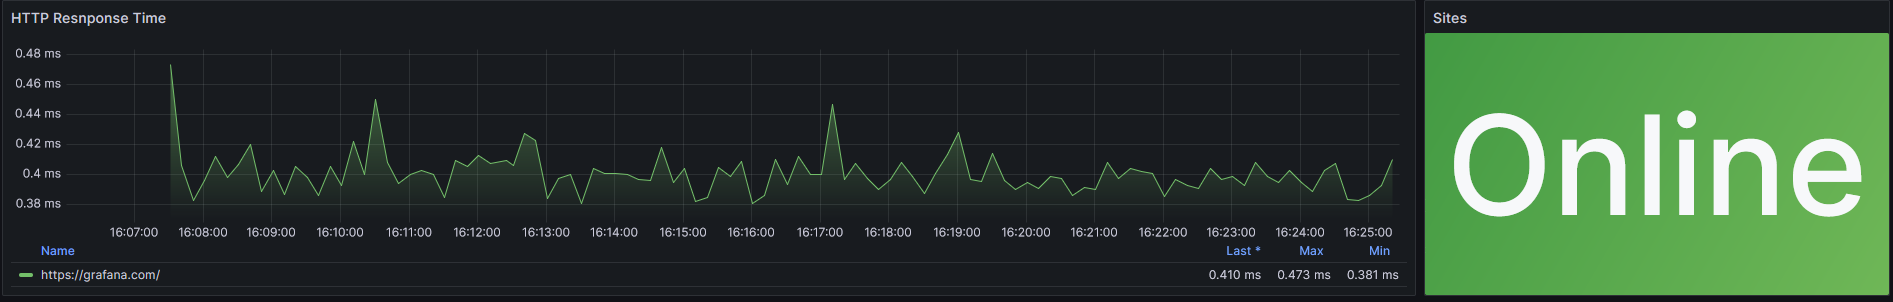
They indicate that the monitored site is available and functional.
Let’s create a chart to monitor the site’s SSL certificate.
On the host computer, edit the “telegraf.conf” file:
vim /etc/telegraf/telegraf.confFind the “inputs.x509_cert” code block and point the path of the certificate used on the site in “sources” and configure an interval of 300s:
[[inputs.x509_cert]]
   sources = ["/srv/volumes/grafana/mycert.crt"]
   interval = "300s"
Restart telegraf:
systemctl restart telegrafAccess Grafana and create a new visualization. Edit the bottom menu as follows:

In “SELECT,” configure a “math” field with the following value:
/60/60/24On the right-hand side menu, select “Stat” as the chart type and give it a title.
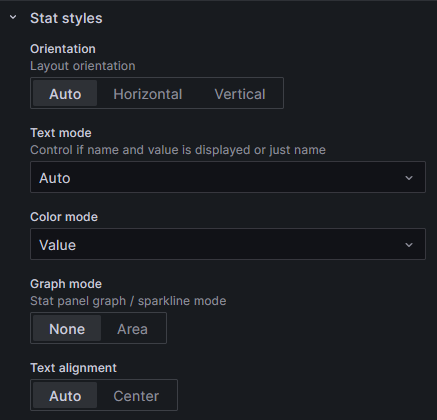
In “Stat styles,” configure as follows:
In “Standard options,” configure as follows:
This time, in “Thresholds,” configure like this:

Click “Apply,” and in the end, you will have the following monitor panel.

If one of the machines stops, you will see it on your monitor. Let’s stop the network on the Client-1 computer to test it.
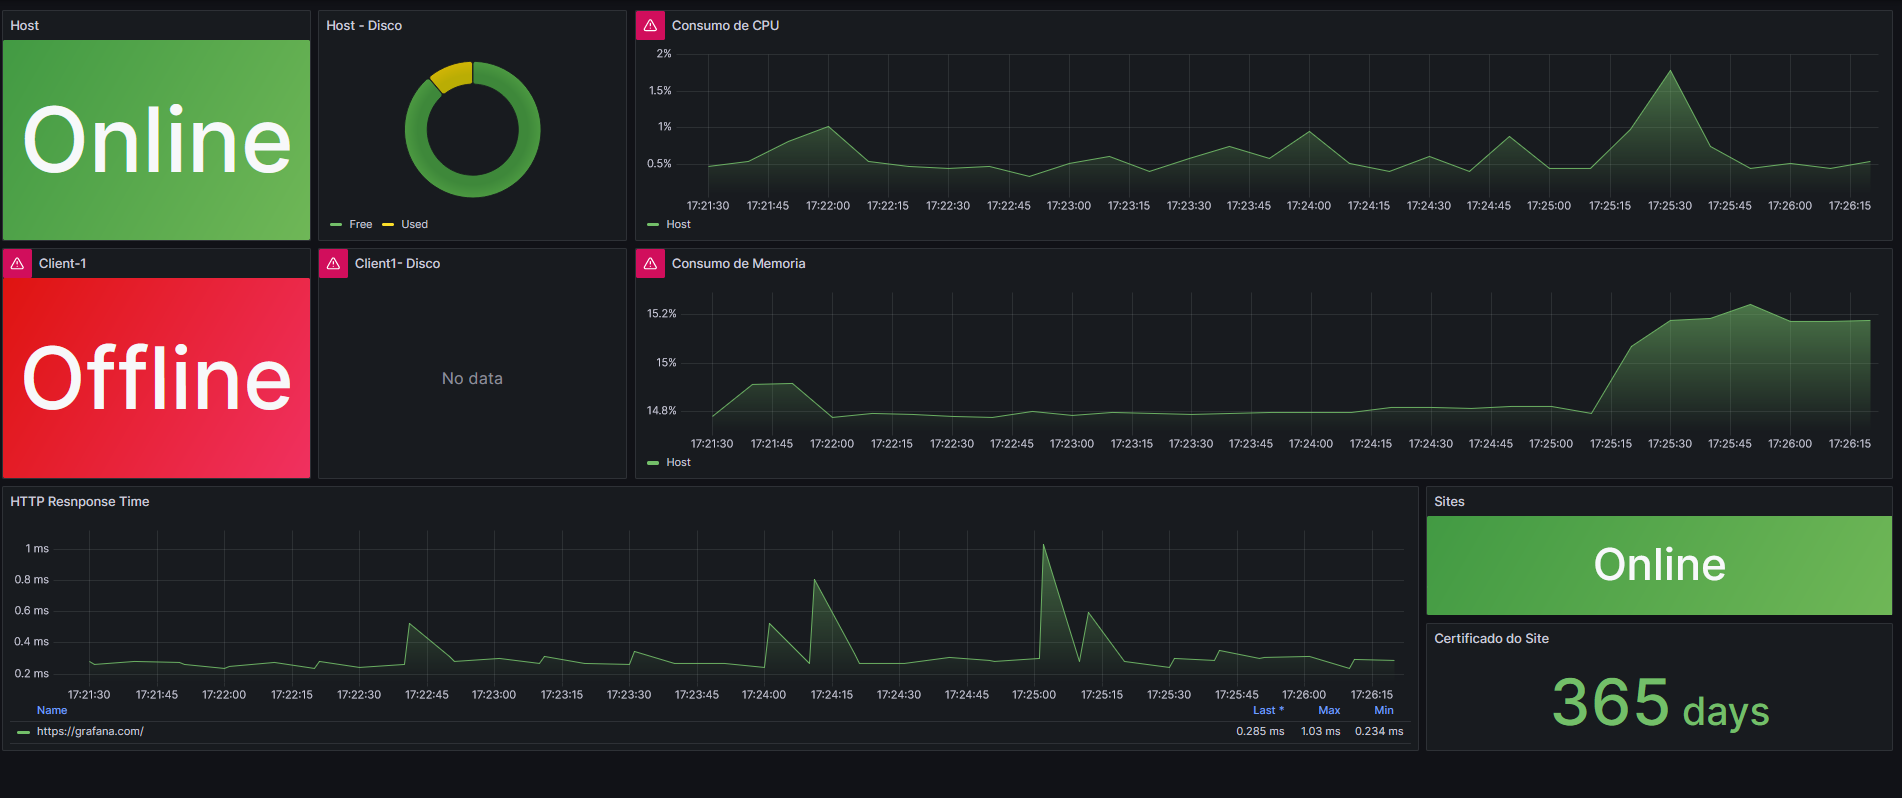
It’s ready, a CPU, memory, disk storage, and site monitoring panel.
Access the Grafana Dashboards website and see the ready-to-import dashboards.
We hope this article has been helpful to you. In the next article, we will configure the alerts.
Leave a Reply