In this article, we will install Grafana on CentOS, but you can use it as a basis by adapting the steps for Debian distributions.
To Install Grafana first install some utilities, Docker, and Docker Compose:
sudo yum install -y yum-utils
sudo yum-config-manager --add-repo https://download.docker.com/linux/centos/docker-ce.repo
sudo yum install docker-ce docker-ce-cli containerd.io docker-buildx-plugin docker-compose-plugin
Enable and start Docker:
sudo systemctl enable docker
sudo systemctl start docker
Create directories for Grafana volume:
mkdir -pv /srv/volumes/grafanaCreate Grafana container:
docker run --restart=always -d -p 3000:3000 --name grafana -v /srv/volumes/grafana:/var/lib/graf --network=bridge grafana/grafanaCheck the container with the command:
docker ps
Install, enable, and start Telegraf:
wget https://dl.influxdata.com/telegraf/releases/telegraf-1.8.3-1.x86_64.rpm
sudo yum localinstall telegraf-1.8.3-1.x86_64.rpm
systemctl enable telegraf
systemctl start telegraf
Check the service with the command:
systemctl status telegraf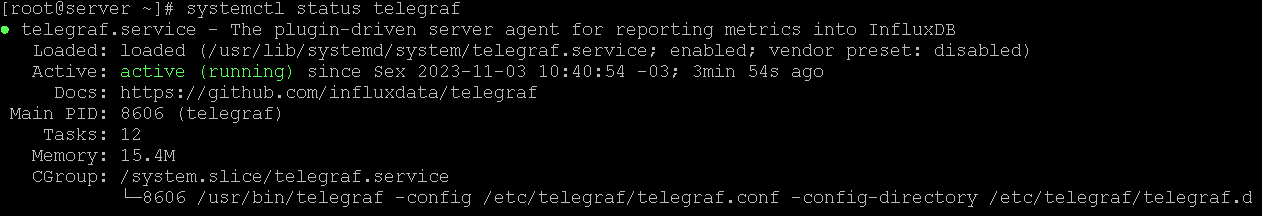
Install and start InfluxDB:
cat <<EOF | sudo tee /etc/yum.repos.d/influxdb.repo
[influxdb]
name = InfluxDB Repository - RHEL \$releasever
baseurl = https://repos.influxdata.com/rhel/\$releasever/\$basearch/stable
enabled = 1
gpgcheck = 1
gpgkey = https://repos.influxdata.com/influxdata-archive_compat.key
EOF
sudo yum install influxdb
sudo systemctl status influxdb
sudp systemctl start influxdbCheck the service with the command:
systemctl status influxdb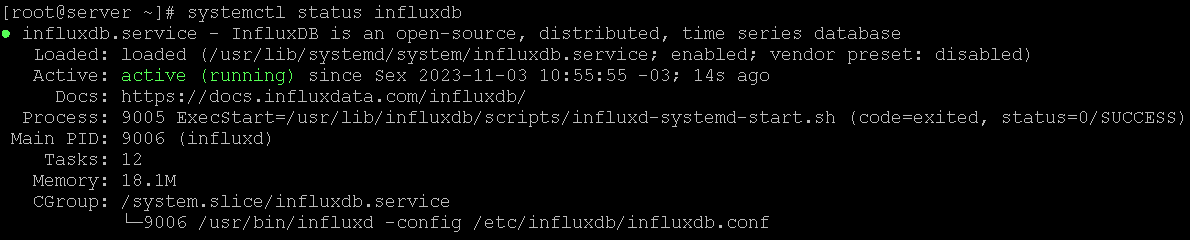
Let’s make some configurations in the Telegraf configuration file:
Edit the telegraf.conf file in the directory /etc/telegraf/:
vim /etc/telegraf/telegraf.confSearch for the block called inputs.docker (it’s on line 1802) and edit it like this:
## para habilitar a coleta de dados do docker
[[inputs.docker]]
endpoint = "unix:///var/run/docker.sock"
gather_services = false
container_names = []
container_name_include = []
container_name_exclude = []
timeout = "5s"
perdevice = true
total = false
docker_label_include = []
docker_label_exclude = []
Search for the inputs.ping block and edit it like this:
## para habilitar a verificação de status por meio de ping
[[inputs.ping]]
name_suffix = "_Host"
urls = ["IP-do-Computador"]
count = 3
interval = "60s"
timeout = 2.0
Remember to edit the urls field according to your IP.
Run this command to give Telegraf permission to monitor Docker:
sudo usermod -aG docker telegrafRestart Telegraf:
systemctl restart telegrafSMTP Email Configuration
Now let’s configure SMTP and HTTPS for Grafana.
Access the Grafana container:
sudo docker exec -it -u root grafana bashEdit the grafana.ini file in the /etc/grafana/ directory:
vi /etc/grafana/grafana.ini
Search for the block called [smtp].
Here you should configure it according to your email server information. The configuration will look something like this:
[smtp]
enabled = true
host = localhost:465
user = user@domain.com
password = """Pass$"""
skip_verify = true
from_adress = user@domain.com
from_name = Grafana
In the host field, you should put the hostname or IP of your email server and SMTP port. For example, for Gmail, it would be smtp.gmail.com:587.
You can put your email in the user and from_address fields.
If the password has special characters, they should be within three double quotes.
Note that comments in this file are made with ; (semicolon). Remove the ; sign from these lines.
Save and exit the file.
Exit the container with ctrl + p + q.
HTTPS Protocol Configuration
To enable the HTTPS protocol, an SSL certificate is required. If you already have the certificate, just copy it to the container’s volume folder. If you don’t have it, you can generate it with the steps below.
Generate a signing key:
openssl genrsa -out mycert.key 2048Using this key, request the certificate with the command:
openssl req -new -key mycert.key -out mycert.csrHere you should fill in the requested information. Fill in according to your information.
Now you need to sign the csr file:
openssl x509 -req -days 365 -in mycert.csr -signkey mycert.key -out mycert.crtChecking the files, you should have these three files in the directory:
[root@server ~]# ls -l mycert.*
-rw-r--r--. 1 root root 1082 Nov  3 12:01 mycert.crt
-rw-r--r--. 1 root root  944 Nov  3 12:00 mycert.csr
-rw-r--r--. 1 root root 1679 Nov  3 11:59 mycert.key
We created the volume of the Grafana container pointing to the directory /srv/volumes/grafana. So move the certificates to this folder:
mv mycert.* /srv/volumes/grafana/Access the Grafana container again:
sudo docker exec -it -u root grafana bashCheck in the /var/lib/graf directory of the container if the certificates are present:
87da19f74a10:/usr/share/grafana# ls /var/lib/graf
mycert.crt  mycert.csr  mycert.key
Edit the grafana.ini file again:
vi /etc/grafana/grafana.iniSearch for the code block [server] and edit according to:
[server]
protocol = https
http_addr =
http_port = 3000
domain = localhost
root_url = %(protocol)s://%(domain)s:%(http_port)s/
cert_key = /var/lib/graf/mycert.key
cert_file = /var/lib/graf/mycert.crt
enforce_domain = false
Save the file.
Exit the container with ctrl + p + q.
Restart the container:
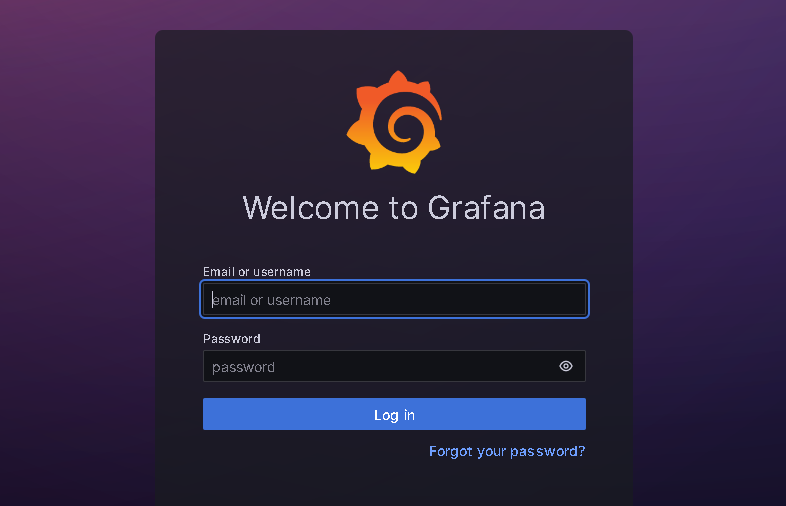
docker restart grafanaAccess the url https://hostname:3000 according to your hostname.
You are now on the Grafana login screen, the first access is done by default with admin user and admin password.
You will be asked to create a new password.
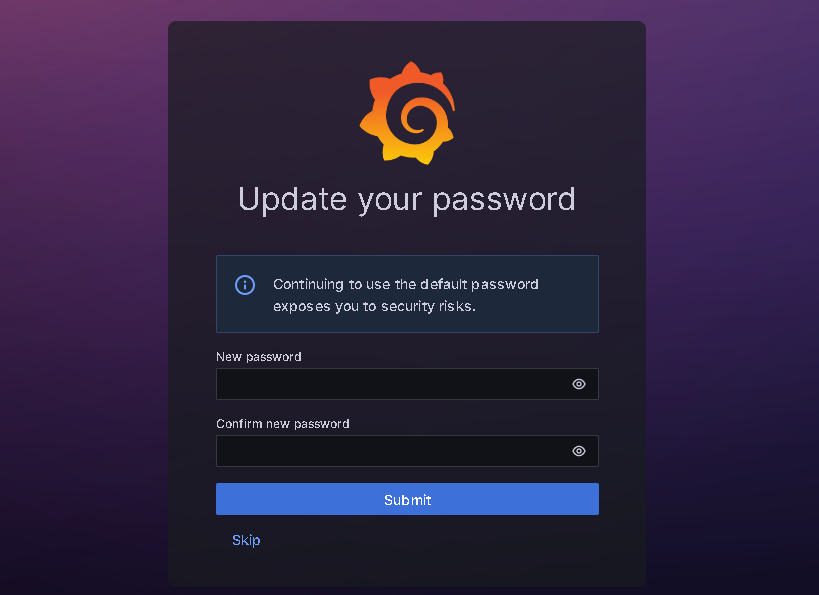
Create the password and access the Grafana interface.
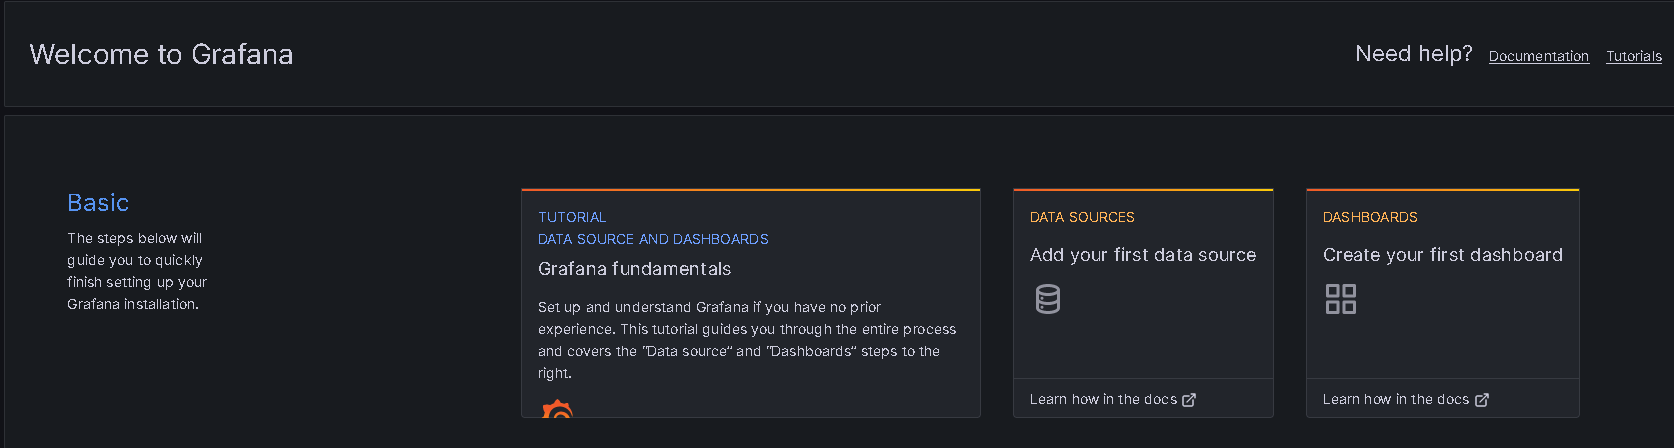
Now we have concluded to install Grafana tool. In the next post, we will configure Grafana clients, or the machines that will be monitored by it.
Leave a Reply