
In the previous article we installed Grafana server. Now we will configure clients that are servers to be monitored. First thing to do is install Telegraf and InfluxDB.
For the installation of Telegraf and InfluxDB carried out in the last article:
Access the article Install Grafana: How to Perform by clicking here
Telegraf
Telegraf Installation
wget https://dl.influxdata.com/telegraf/releases/telegraf-1.8.3-1.x86_64.rpm
sudo yum localinstall telegraf-1.8.3-1.x86_64.rpm
systemctl enable telegraf
systemctl start telegraf
InfluxDB
InfluxDB Installation
cat <<EOF | sudo tee /etc/yum.repos.d/influxdb.repo
[influxdb]
name = InfluxDB Repository - RHEL \$releasever
baseurl = https://repos.influxdata.com/rhel/\$releasever/\$basearch/stable
enabled = 1
gpgcheck = 1
gpgkey = https://repos.influxdata.com/influxdata-archive_compat.key
EOF
sudo yum install influxdb
systemctl enable influxdb
systemctl start influxdbCheck if the service status is active (running) with the commands
systemctl status influxdb
systemctl status telegraf
Edit the file /etc/telegraf/telegraf.conf and make changes in the inputs.ping block
## para habilitar a verificação de status por meio de ping
[[inputs.ping]]
name_suffix = "_Host"
urls = ["IP-Do-Computador"]
count = 3
interval = "60s"
timeout = 2.0
Remember to change the urls field according to your IP
The name_suffix tag will make it easier to find this metric in Grafana, so choose a tag that refers to this computer, such as the computer’s hostname
Restart Telegraf
systemctl restart telegrafImporting clients in Grafana
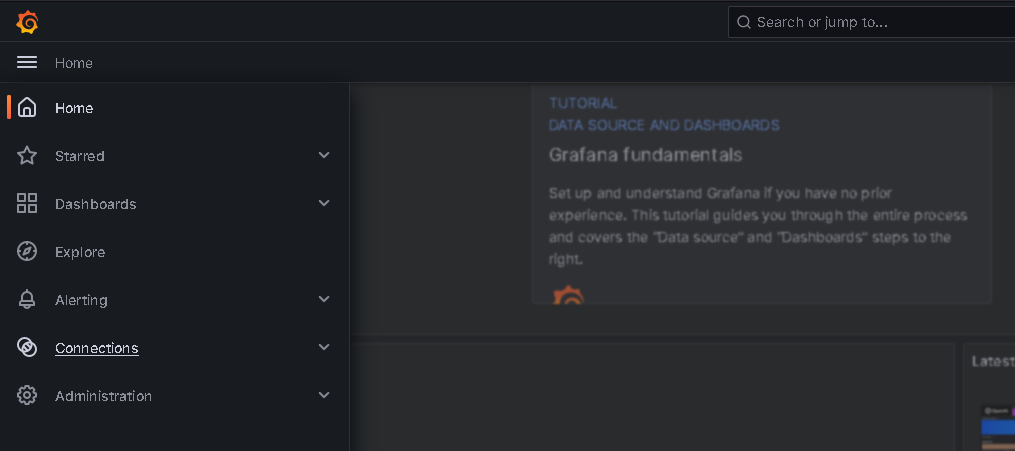
Now import the client into Grafana. To do this, click on the Grafana menu tab in the left sidebar and find the Connections option
In the search field, search for Influxdb and select this option
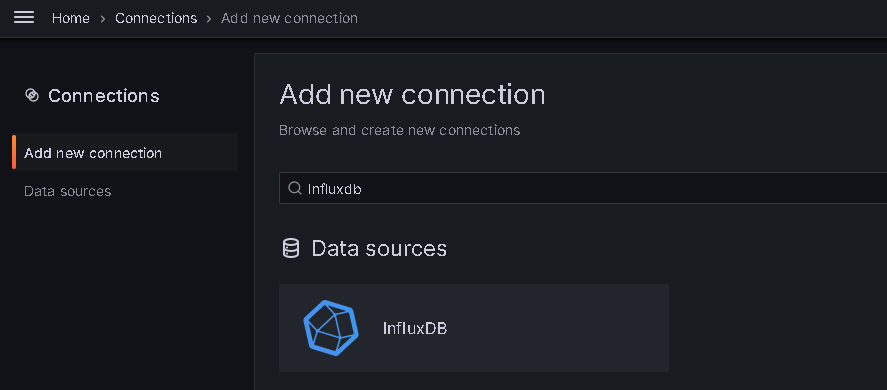
Click on Add new data source
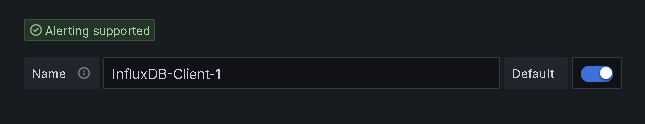
In this part, you will configure the client, the only configurations you will make are
Choose a name for the client
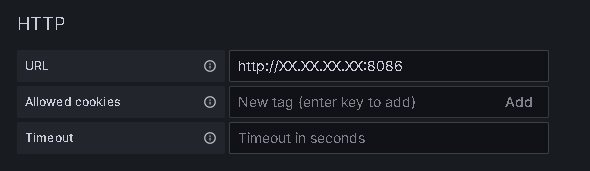
Enter the URL according to the client’s IP using the influxdb port 8086 (Example: http://xx.xx.xx.xx:8086)
In InfluxDB Details, enter the telegraf database in the Database field

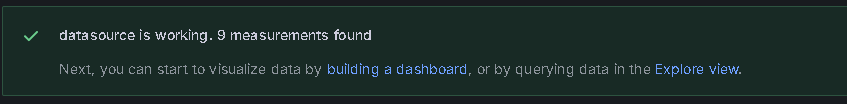
Click Save & test
This message will appear and it means the configuration worked
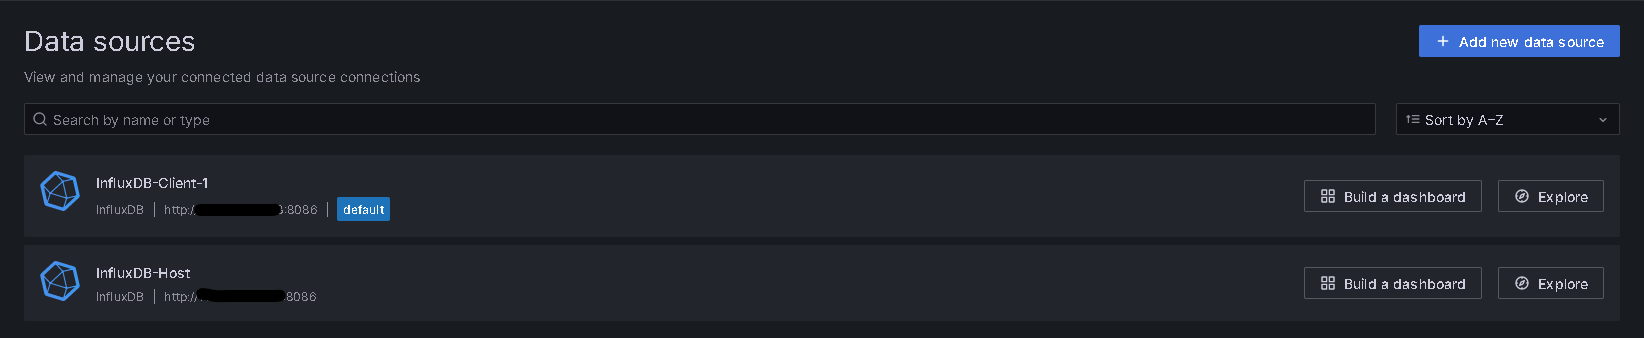
Repeat the same procedure for the Grafana Host computer, where it was installed. The data sources will look like this:
Done, here finishes the Grafana server client configuration, repeat these steps for every computer you want to monitor
In the next article we will work on creating some monitoring charts.
Leave a Reply