
Grafana is a comprehensive and free monitoring solution that has been increasingly used by companies and organizations of all sizes. With an intuitive and easy-to-use interface, it allows users to visualize and analyze data from different sources in real-time.
As an open-source platform, it offers a wide variety of monitoring features, such as graphs, dashboards, alerts, among others. The tool supports a large variety of data sources, including databases, cloud services, monitoring systems, among others. Additionally, it is highly scalable and can be deployed in different environments, from small businesses to large corporations. With its wide range of features and flexibility, Grafana has become one of the most popular monitoring tools on the market.
Grafana Overview
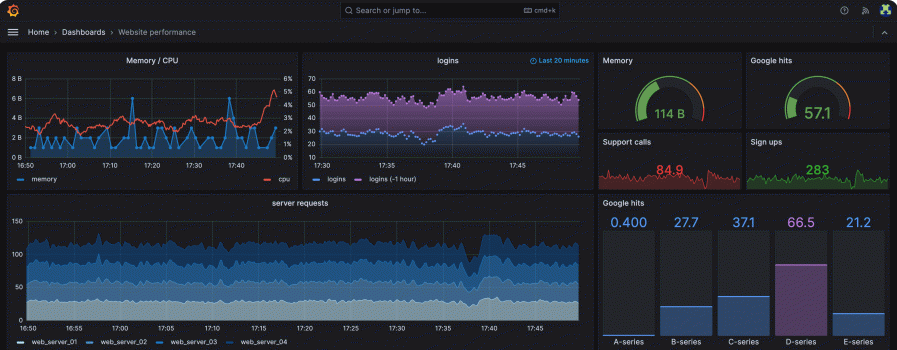
Grafana allows you to visualize data from various sources on a single dashboard. It helps you monitor, analyze, and understand metrics and logs from different sources in real-time.
Key Features
Grafana offers a wide variety of features, including:
- Support for different data sources, including SQL databases, NoSQL, Prometheus, Elasticsearch, among others.
- Custom dashboards, which allow you to create personalized data visualizations;
- Alerts, which enable you to define rules to notify when certain conditions are met;
- Plugins, which allow you to extend Grafana’s functionality.
It’s highly configurable and can be customized to meet the specific monitoring needs of each company or project.
Licensing and Versions
Grafana is an open-source tool distributed under the Apache 2.0 license. This means it can be used freely, with no restrictions, for both commercial and non-commercial purposes.
The tool is regularly updated and has different versions available, including a free version and an Enterprise version, which offers additional features such as priority technical support and integration with other monitoring tools.
Installation and Configuration
To start using Grafana, it’s necessary to perform some initial configurations. We’ve created a comprehensive guide for installation and setup. By following the tutorials below, you’ll be able to start using Grafana in your company. We’ve provided a detailed step-by-step installation guide; click on the links below to access it.
Building Dashboards
Grafana allows the creation of custom dashboards for data visualization. In this section, the available features for dashboard construction will be presented.
Supported Data Sources
Grafana supports a wide variety of data sources, including SQL databases, NoSQL databases, cloud services, APIs, and others. The complete list of supported data sources can be found in the official documentation.
Creating Panels in Grafana
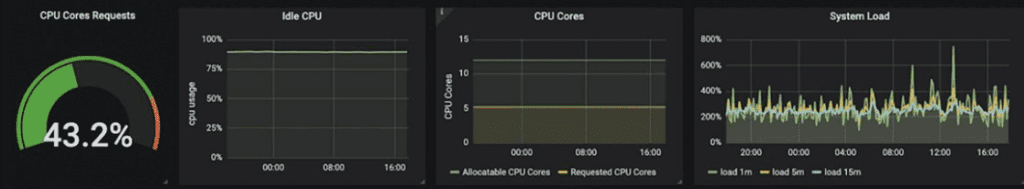
Grafana offers a wide variety of visualization types, including line charts, bar charts, pie charts, tables, and more.
It allows the creation of panels with multiple visualizations, enabling the comparison of different data sets in a single panel.
Visualizations and Plugins
Grafana offers a wide variety of visualizations and plugins to further customize the panels. Visualizations include heatmaps, maps, gauges, and more. Plugins enable integration with external services such as Slack, PagerDuty, and others.

Also, it has an active community of developers who regularly create new visualizations and plugins.
Ready-made dashboards available for free
Grafana offers a wide range of ready-made dashboards for various services that can be simply imported and added to your panel. There are ready-made dashboards for monitoring tools like Docker, Nginx, RabbitMQ, and many others. Just search for the available options and make use of the graphs.
Click here to access the Grafana Dashboards website and find all available dashboards for import.
Alerts and Notifications
Grafana offers advanced alerting and notification features to help users stay informed about the status of their systems.
Alert Configuration in Grafana
With Grafana, it’s possible to configure alerts to monitor specific metrics and be notified when a metric exceeds a defined threshold. Users can configure alerts for any panel or graph and customize the alert conditions to meet their specific needs.
Also see

Users can also set alert actions, such as sending an email notification. This allows users to take immediate action to address issues before they become critical.
Notification Channels
Grafana supports a variety of notification channels, including email, Slack, Telegram, and many others. Users can configure multiple notification channels to ensure they receive alerts in a timely manner, regardless of where they are or what device they are using.
Additionally, it allows users to customize notification messages to include important information, such as the current value of the metric and the time the alert was triggered. This helps ensure that users have all the necessary information to take appropriate action in response to an alert.
Security and Administration
In this section, two important aspects will be covered: Access Control and Auditing and Logs.
Access Control
Grafana offers a robust and flexible access control system, allowing administrators to define different levels of permission for each user or group of users. It is possible to create users with permissions only for viewing, or grant full access for creating and editing panels and dashboards.
Additionally, Grafana supports authentication through various providers, such as LDAP, OAuth, Google, and GitHub, making the user management process even easier and more secure.
Auditing and Logs
Grafana also features a comprehensive auditing and logging system, allowing you to track all activities performed by users. You can view information such as who created or edited a panel, when the change was made, and what content was modified.
Moreover, Grafana allows the configuration of alerts to notify administrators in case of suspicious activities or unauthorized access attempts.
With a robust and flexible access control system, and a comprehensive auditing and logging system, Grafana is a secure and reliable choice for businesses of all sizes.
Integrations and APIs
Integration with Other Tools
One of Grafana’s main advantages is its ability to integrate with other monitoring and data analysis tools. It can be easily integrated with different types of databases, such as MySQL, PostgreSQL, InfluxDB, Elasticsearch, among others.
Furthermore, Grafana can also be integrated with other monitoring tools like Prometheus, Zabbix, Nagios, among others. This integration capability allows users to have a more comprehensive view of their environment, being able to monitor different aspects of their system in a single location.
Using the Grafana API
Grafana also features an API that enables integration with other tools and task automation. With the API, it’s possible to create and manage panels, dashboards, users, data sources, among other Grafana resources.
The Grafana API is well-documented and has various libraries in different programming languages, making it easy to use. With it, you can create scripts and automations to manage your monitoring environment more efficiently and customized.
In summary, Grafana’s integrations and API are fundamental features for those seeking a comprehensive and customized monitoring and data analysis solution. With these features, you can integrate different tools and automate tasks, making your monitoring environment more efficient and productive.
Community and Support
There is a dedicated Grafana community that can provide support for the tool. However, it is also possible to find help in other communities such as Stack Overflow and GitHub.
Grafana Documentation
The official documentation is comprehensive, with step-by-step tutorials and usage examples.
Click here to access the Grafana documentation.
Open Source Contributions
Grafana is an open-source solution and encourages community participation in its development. Anyone can contribute code, fixes, documentation, and improvement suggestions through GitHub. The development team is active and regularly reviews the contributions received.
With an active community and quality support, Grafana is a reliable and comprehensive solution for monitoring.
Leave a Reply